

AI chatbot analytics is the measurement discipline that ties chatbot conversations to revenue and continuous improvement. It tracks eight core KPIs (automation rate, resolution, containment, handoff, fallback, conversion, CSAT, and cost per resolution), adds LLM-specific metrics for generative bots, and feeds findings back into weekly retraining so performance compounds rather than plateaus.
Leadership asks the question every quarter: "Is the chatbot actually working?" The dashboard shows thousands of conversations, high engagement time, a satisfaction score rounded to three decimals. And yet nobody can answer the one question that matters, did it move the number?
This is the analytics gap that sinks most AI chatbot programs. Teams track volume when they need to track outcomes. They measure how the bot feels when they need to measure what the bot did. The fix is a measurement framework where every metric ties to a business outcome and where the team running the AI voice and chatbot solutions has authority to retrain weekly rather than reporting monthly. Below, you will learn why vanity metrics mislead leadership, the eight KPIs that actually matter in 2026, the new LLM-specific metrics to instrument, the events your data layer must capture, and the closed-loop optimization cycle that moves automation rate 3 to 8 points every quarter.
Why Chatbot Vanity Metrics Miss the Point
Message count, session duration, and user engagement are easy to measure and tell you almost nothing about whether the chatbot is working. A long conversation can mean the bot failed three times before giving up. A short conversation can mean the bot solved the problem in one exchange. High engagement can mean high confusion. The numbers that look healthy on a dashboard often correlate negatively with the outcomes leadership actually cares about, which is why dashboards showing high engagement scores often coexist with rising support tickets and falling automation rates.
The metrics that matter pass one simple test: if the number moves, does a business outcome move with it? Automation rate, resolution rate, and conversion rate pass that test. Session count and message volume do not. The same test applies to LLM-specific metrics. Hallucination rate matters because it ties to trust and compliance exposure, and token count matters because it ties to unit economics. Once the team agrees on which metrics are causal and which are descriptive, reporting changes from theatre to decision support.
The vanity-metrics problem persists because the dashboards that come out of the box with most chatbot platforms emphasize volume metrics. The discipline of building a custom dashboard that surfaces the eight KPIs is what separates programs that compound from programs that plateau.
Table 1: Vanity Metrics vs Outcome Metrics
| Vanity Metric | What It Looks Like | Outcome Metric to Use Instead |
| Total conversations | High volume, ambiguous meaning | Automation rate (% resolved by bot) |
| Session duration | Long sessions can mean confusion | Resolution rate (% of intents satisfied) |
| Engagement time | Time-on-bot decoupled from outcome | Conversion rate (% completing a goal) |
| Total messages | Volume without quality signal | Containment rate (% never reaching agent) |
| Star rating | Single-number summary, low diagnostic | CSAT trend over time |
The 8 AI Chatbot Analytics KPIs That Matter in 2026
Per Gartner's research on customer service automation, over 75% of customer service interactions will be automated by 2026, which makes the discipline of measuring chatbot performance a leading indicator for cost-to-serve. The eight KPIs below split into three groups: efficiency metrics (automation, resolution, containment), risk metrics (handoff, fallback), and value metrics (conversion, CSAT, cost per resolution). Tracking all three prevents over-optimizing for one dimension at the expense of another.
The eight core KPIs in detail:
- Automation Rate. Percentage of conversations fully resolved by the bot without human handoff. Benchmark: 70 to 85% for well-optimized customer service chatbots. The headline KPI for any cost-reduction conversation with leadership.
- Resolution Rate. Percentage of sessions where the user's intent was fully satisfied. Different from automation rate because a user can complete a session (close the chat) without actually being resolved. Instrument end-of-conversation feedback to separate the two.
- Containment Rate. Percentage of users helped without ever touching a human agent. The cost-reduction metric, where every point of containment equals a reduction in agent workload.
- Handoff Rate / Escalation Rate. The inverse of containment, measured as a quality signal. A rising handoff rate means bot capability is eroding or user expectations are expanding, and either way training attention is required.
- Fallback Rate. Percentage of turns where the bot says "I don't understand" or routes to a generic response. Benchmark: below 10%. Above that, intent coverage needs expansion.
- Conversion Rate. Percentage of bot conversations that result in a business outcome such as a demo booked, cart completed, form submitted, or account created. The KPI that proves the bot moves pipeline, not just conversations.
- CSAT / Post-Conversation Satisfaction. User-reported satisfaction, typically a 1 to 5 star scale at conversation close. Useful as a trend indicator, noisy as an absolute measure. Weight recent responses higher than historical ones because user expectations keep shifting.
- Cost per Resolution. Total operating cost divided by successfully resolved conversations. The number the CFO cares about. Compare to human cost-per-ticket to quantify real savings.
Each KPI has its own benchmark range that varies by deployment maturity. Use the table below as internal targets and quarterly comparison points. Your numbers reflect your use case, channel, and user base, which makes external benchmarks useful as a directional signal but rarely as a like-for-like comparison.
Table 2: KPI Benchmarks by Deployment Maturity
| KPI | Early-Stage | Optimized | Elite | What a Miss Means |
| Automation Rate | 40 to 55% | 70 to 85% | 85%+ | Intent coverage too narrow, or flows broken |
| Resolution Rate | 50 to 65% | 75 to 85% | 90%+ | User leaves chat without actual help |
| Containment Rate | 45 to 60% | 70 to 80% | 85%+ | Too much premature handoff |
| Fallback Rate | 15 to 25% | <10% | <5% | Intent library needs expansion |
| Conversion Rate | 2 to 5% | 8 to 15% | 18%+ | Bot not positioned in buying conversations |
| CSAT | 3.5 to 4.0 | 4.2 to 4.6 | 4.7+ | Tone, speed, or accuracy issues |
LLM-Specific Metrics for Generative Chatbots
LLM-powered chatbots add a layer of measurement that traditional rule-based bots do not require. The economics and trust profile of generative AI deployments depend on metrics that sit beneath the conversational surface, and ignoring them produces deployments that look fine on traditional dashboards while quietly accumulating risk and cost. Four metrics matter most:
- Response latency. Time from user message to bot reply. Generative models add latency from inference and retrieval, and latency above 3 to 5 seconds correlates with user drop-off in synchronous chat experiences.
- Token cost per conversation. Direct LLM spend per conversation. The unit-economics metric that determines whether the chatbot is actually cheaper than human handling once you factor in inference cost, retrieval cost, and any tooling fees.
- Hallucination rate. Percentage of responses containing factual errors detected in review. The metric that matters most in regulated industries (healthcare, legal, financial services) where a confident wrong answer is worse than no answer.
- Grounding rate. Percentage of responses citing retrieval sources rather than generating from parametric memory. The leading indicator for hallucination, where high grounding correlates with low hallucination and reliable citation behavior.
These metrics are typically invisible on out-of-the-box chatbot dashboards but drive both the economic profile and the trust profile of any LLM-based deployment. A chatbot with strong automation and conversion metrics but a 12% hallucination rate in a regulated industry is a compliance incident waiting to happen, and the time to discover that is during weekly review rather than after a customer complaint reaches legal. Programs that run AI automation services at scale instrument these LLM-specific metrics from day one.
Table 3: LLM-Specific Metrics and Why They Matter
| Metric | What It Measures | Why It Matters |
| Response latency | Time from message to reply | High latency correlates with drop-off |
| Token cost per conversation | Direct LLM spend | Unit economics vs human handling |
| Hallucination rate | % of factually incorrect responses | Trust and compliance exposure |
| Grounding rate | % citing retrieval vs parametric memory | Leading indicator for low hallucination |
Events to Instrument

Analytics is only as good as the event layer underneath. Weak instrumentation produces dashboards that look comprehensive but cannot answer specific questions when leadership asks them. The minimum event set that supports the eight core KPIs and the LLM-specific metrics includes the following:
- session_start and session_end with timestamps
- user_message with intent classification and confidence score
- bot_response with response source (rule, flow, LLM, retrieval)
- handoff_triggered with reason code
- fallback_triggered with context
- goal_completed with goal type (demo, purchase, form, account)
- csat_submitted with rating and free-text comment
Ship these events to the same analytics warehouse as your website and CRM data. The moment chatbot events join website sessions and CRM records, conversion attribution becomes real rather than theoretical, and leadership can see which conversations created which revenue rather than which campaigns drove which sessions. The CRM bridge is what turns chatbot analytics from a platform-level reporting layer into a business-level performance system.
The instrumentation work is one-time. Most teams complete it in two to three weeks once the warehouse path is defined and the events are wired into the chatbot platform. The payoff continues for as long as the chatbot is in production, because every new question leadership asks can be answered against the same event stream.
The Closed-Loop Optimization Cycle
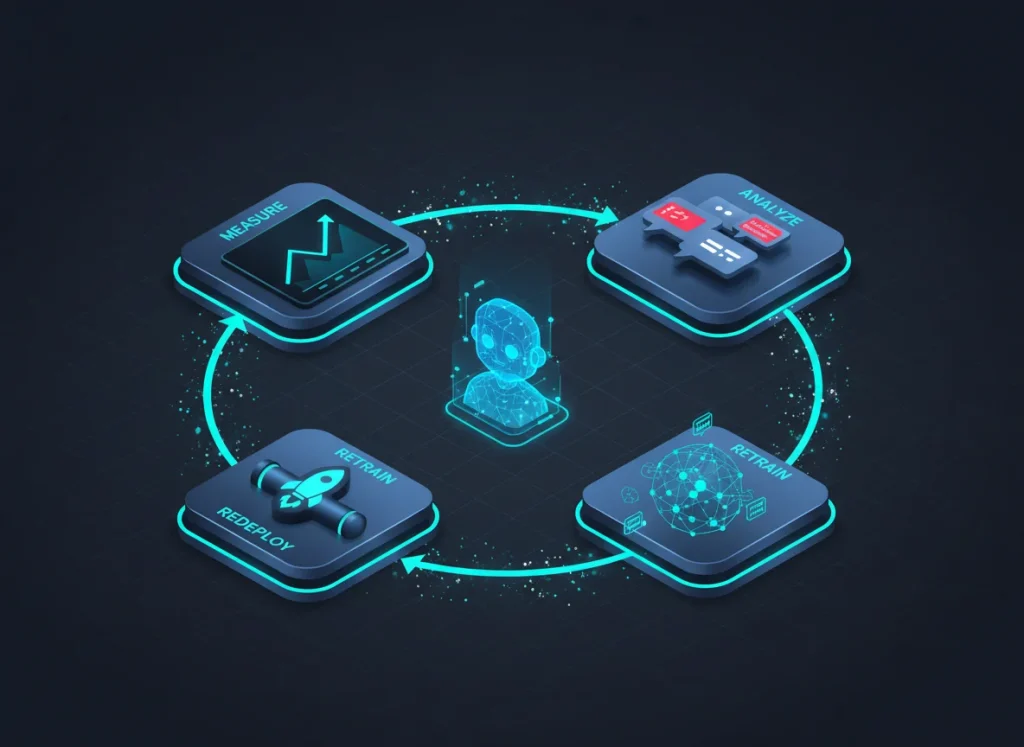
Measurement without feedback is reporting. The chatbot programs that keep improving run a weekly optimization cycle, and Forrester research on conversational AI frames the loop as Measure → Analyze → Retrain → Redeploy. The cycle does not require a data science team. Any enablement leader with dashboard access, content ownership, and deployment rights can run it. The four steps:
- Measure (daily). Refresh the 8 KPI dashboard. Flag any metric outside its control band.
- Analyze (weekly). Pull the top 10 failing conversations. Cluster them by intent to find patterns. Identify the 3 to 5 intents driving the most fallback or escalation.
- Retrain (weekly). Add new training examples to failing intents. Expand flows where users drop off. Refine LLM prompts where hallucinations or grounding failures appear.
- Redeploy (weekly). Push updated models to production behind a canary rollout. Monitor the first 500 conversations for regression before full promotion.
A team running this loop weekly improves automation rate 3 to 8 points per quarter, a rate that compounds meaningfully across a year. Teams that "set and forget" plateau within 90 days and start to decay as user expectations expand. The closed loop is what keeps the chatbot ahead of the curve rather than chasing it.
Tying Performance to CRM and Revenue
The last mile of chatbot analytics is the CRM bridge. Every qualified conversation should create or update a CRM record with source attribution, the intent that was captured, and the value of any goal completed. When the CRM carries that data, the revenue team can answer the leadership question with closed-won dollars rather than dashboard screenshots. The bridge is technically straightforward but organizationally hard, because it requires alignment between the chatbot platform owner, the CRM administrator, and the revenue operations team.
This is where chatbot analytics meets CRM data hygiene. Dirty data breaks attribution, and duplicate contacts, missing emails, and orphaned session IDs prevent the closed-loop report from holding up in a revenue review. Authority Solutions® as an internet marketing company has seen the bridge work most reliably when the chatbot platform pushes events into a customer data platform or warehouse, which then writes back to the CRM. The intermediate layer absorbs the messiness of session IDs and multi-touch attribution that direct connections struggle with.
Common Analytics Failures and How to Fix Them
Four patterns show up repeatedly in chatbot analytics programs that stall, and each has a specific remediation:
- Dashboard sprawl. Teams measure everything and decide nothing because no metric is elevated above the others. Fix: designate the 8 KPIs as primary, everything else as diagnostic.
- Misaligned benchmarks. Teams compare their numbers to vendor case studies and get discouraged. Fix: benchmark against your own trajectory, asking whether the number is moving the right direction quarter over quarter.
- No owner for the loop. The Measure → Analyze → Retrain → Redeploy cycle needs a named owner. Without one, it becomes a meeting on the calendar that nobody acts on. Fix: assign a single accountable operator with authority to ship retrains.
- No CRM bridge. Chatbot analytics lives in the chat platform while revenue lives in the CRM. The two never meet. Fix: event pipeline into the CRM with conversation-level attribution.
Each of these failures is recoverable, but the longer they run unaddressed, the more the program drifts toward the "is the chatbot working?" conversation that has no good answer. Catching them in the first 90 days of a deployment is significantly cheaper than catching them later when the dashboards have ossified and the team has moved on.
Key Takeaways
- Message count, session duration, and engagement time are vanity metrics that do not predict business outcomes. Automation rate, resolution rate, and conversion rate pass the causal test of moving with real performance.
- The 8 KPIs that matter are automation rate, resolution rate, containment rate, handoff rate, fallback rate, conversion rate, CSAT, and cost per resolution. Optimized deployments hit 70 to 85% automation and below 10% fallback.
- LLM-powered chatbots add four metrics: response latency, token cost per conversation, hallucination rate, and grounding rate. These drive both the economic and trust profile of generative AI deployments.
- Gartner projects over 75% of customer service interactions will be automated by 2026, and chatbots without closed-loop analytics will fall behind faster as user expectations expand.
- Weekly Measure → Analyze → Retrain → Redeploy cycles typically move automation 3 to 8 points per quarter, while set-and-forget chatbots plateau within 90 days and start to decay.
- The CRM bridge is what turns chatbot analytics into a revenue conversation. Without conversation-level attribution flowing into the CRM, the chatbot remains a measurable cost rather than a measurable contributor.
Getting Your Chatbot Analytics Right
Start with the baseline. Pull your current automation rate, resolution rate, and conversion rate. If any of the three is below benchmark, that is the first focus, not new features, not a new platform, not a retool. Tightening the measurement layer first means that any subsequent investment is informed by data rather than guesswork. The 60-day cycle of measurement, analysis, and retraining will tell you exactly where to invest next.
Once the baseline is set, the program runs on the weekly cycle described earlier with a named owner, a clear dashboard, and the CRM bridge in place. The architecture decisions matter most in the first 30 days. Choosing the event schema, defining the warehouse path, and aligning the chatbot platform with the CRM are the moves that determine how much rework the program needs in year two. Programs that get the architecture right at the start typically scale without major rebuilds.
To baseline your current eight KPIs, identify your top fallback intents, and stand up the closed-loop cycle, contact us for a Chatbot Analytics Review.
Conclusion
Message volume is a vanity metric. Automation rate, conversion rate, cost per resolution, and hallucination rate are the numbers that prove an AI chatbot is moving the business. Instrument the event layer, elevate the 8 KPIs, run the weekly Measure → Analyze → Retrain → Redeploy loop, and tie every conversation back to the CRM. Teams that do this compound 3 to 8 automation points every quarter while competitors plateau.
Frequently Asked Questions
What is AI chatbot analytics?
AI chatbot analytics is the measurement discipline that tracks a chatbot's performance across automation, resolution, containment, conversion, and cost metrics, and feeds those insights back into continuous training. It converts a chatbot from a black box into a measurable, improvable system tied to revenue and cost outcomes.
What are the most important AI chatbot KPIs?
The core eight: automation rate, resolution rate, containment rate, handoff rate, fallback rate, conversion rate, CSAT, and cost per resolution. LLM-specific chatbots add four more: response latency, token cost per conversation, hallucination rate, and grounding rate.
What is a good automation rate for an AI chatbot?
Benchmark: 70 to 85% for well-optimized customer service chatbots. Early-stage deployments typically start at 40 to 55% and improve with each training cycle. Elite deployments in mature contact centers reach 85%+ automation, though the last 10 points usually require specialized intent coverage.
How do I measure chatbot ROI?
Calculate cost per resolution and compare to human cost-per-ticket for the savings side. Then measure conversion rate and attach revenue value to goal completions for the pipeline side. Both together equal chatbot ROI. Make sure both flow through the CRM so the math survives a CFO review.
How often should chatbot analytics be reviewed?
Daily for operational KPIs and anomaly detection, weekly for the closed-loop optimization cycle, and monthly for executive reporting. Quarterly, benchmark against the previous quarter's trajectory rather than against external case studies, since case studies reflect different use cases and channels.
What is fallback rate and why does it matter?
Fallback rate is the percentage of turns where the bot cannot handle the input and either says "I don't understand" or routes to a generic response. The benchmark is below 10%. Above that, the intent library is too narrow and users experience the bot as unhelpful.
What is the difference between automation rate and resolution rate?
Automation rate measures what percentage of sessions the bot handled to completion without a human. Resolution rate measures what percentage actually solved the user's problem. The gap between them is usually the most important number to investigate, because it identifies sessions the bot completed but did not resolve.
How do I detect chatbot hallucinations in an LLM-powered bot?
Hallucination detection combines automated grounding checks (did the response cite retrieval sources?) with sampled human review. Most mature programs review 2 to 5% of LLM-generated responses weekly, log detected hallucinations, classify by intent, and feed the classifications back into prompt or retrieval tuning.
What events should I instrument for chatbot analytics?
At minimum: session_start, session_end, user_message (with intent and confidence), bot_response (with source), handoff_triggered (with reason), fallback_triggered (with context), goal_completed (with goal type), and csat_submitted (with rating and comment). These feed the 8 core KPIs and LLM metrics.
How long does it take to see chatbot analytics results?
Operational KPI dashboards can be live within 2 to 3 weeks once event instrumentation is in place. Meaningful performance improvement from the closed-loop cycle shows up within 30 to 60 days of starting weekly retraining. Full ROI attribution through the CRM typically takes 90 days to settle into reliable reporting.